MOLECULAR & CELLULAR NEUROBIOLOGY 
Master Course Cognitive Neuroscience - Radboud University, Nijmegen


INDEX

INTRODUCTION CELLS AND WITHIN CELLS IN A NUTSHELL GENOMICS MOLECULAR BIOLOGICAL RESEARCH METHODOLOGY NEURODEVELOPMENT  


Chapter 5: Molecular biological research methodology

           Molecular biology and Recombinant DNA technology Detection of DNA, RNA and protein Generation of gene expression atlases of the CNS
           Techniques used in Molecular Biology    Detection of RNA Gene transfer - transgenic animals
           Genetic transmission    In situ hybridization Optogenetics
           Genetic mapping    PCR Cloning
           Genomic and cDNA libraries    Microarray and RNA-seq analysis Stem cells
   Bioinformatics - data analysis    CRISPR-cas genome editing
  ChIP-chip/seq  


Genetic mapping

Methods employed in genetic epidemiology (achieved either in family studies - segregation, linkage, association - or in population studies - association):

* Genetic risk studies: What is the contribution of genetics as opposed to environment to the trait? Requires family-based or twin/adoption studies.
* Segregation analyses:
What does the genetic component look like (oligogenic 'few genes each with a moderate effect', polygenic 'many genes each with a small effect', etc)? What is the model of transmission of the genetic trait? Segregation analysis requires multigeneration family trees preferably with more than one affected member.
* Linkage studies:
What is the location of the disease gene(s)? The principle is the cosegregation of two genes (one of which is the disease locus).
* Association studies:
What is the allele associated with the disease susceptibility? The principle is the coexistence of the same marker in affected individuals. Association studies may be family-based or population-based.

By the early 1900s, geneticists understood that Mendel's laws of inheritance underlie the transmission of genes in diploid organisms. They noted that some traits are inherited according to Mendel's ratios, as a result of alterations in single genes, and they developed methods to map the genes responsible. They also recognized that most naturally occurring trait variation, while showing strong correlation among relatives, involves the action of multiple genes and nongenetic factors.

Although it was clear that these insights applied to humans as much as to fruit flies, it took most of the century to turn these concepts into practical tools for discovering genes contributing to human diseases. Starting in the 1980s, the use of naturally occurring DNA variation as markers to trace inheritance in families led to the discovery of thousands of genes for rare Mendelian diseases. Despite great hopes, the approach proved unsuccessful for common forms of human diseases—such as diabetes, heart disease, and cancer—that show complex inheritance in the general population.

Over the past year, a new approach to genetic mapping has yielded the first general progress toward mapping loci that influence susceptibility to common human diseases. Still, most of the genes and mutations underlying these findings remain to be defined, let alone understood, and it remains unclear how much of the heritability of common disease they explain.

 
Genetic mapping by linkage and association

Genetic mapping is the localization of genes underlying phenotypes on the basis of correlation with DNA variation, without the need for prior hypotheses about biological function. The simplest form, called linkage analysis, was conceived for 
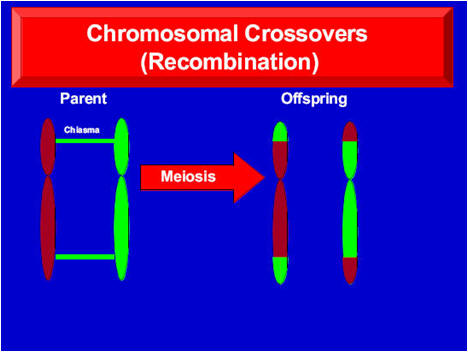
fruit flies in 1913. Linkage analysis involves crosses between parents that vary at a Mendelian trait and at many polymorphic 
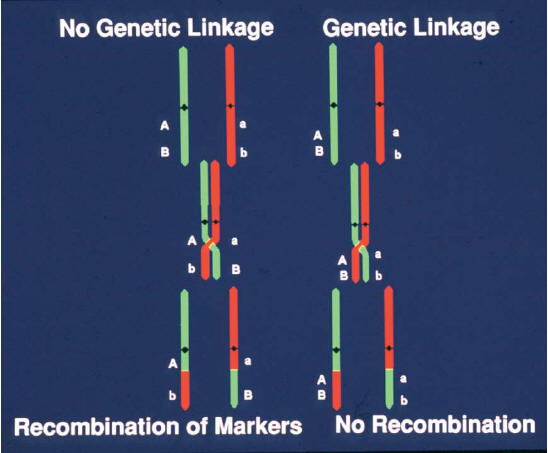
variants ("markers"); because of meiotic recombination, any marker showing correlated segregation ("linkage") with the trait must lie nearby in the genome.

In the 1970s, the ability to clone and sequence DNA made it possible to tie genetic linkage maps in model organisms to the underlying DNA sequence, and thereby to molecularly clone the genes responsible for any Mendelian trait solely on the basis of their genomic position. Such studies typically involved three steps: (i) identifying the locus responsible through a genome-wide search; (ii) sequencing the region in cases and controls to define causal mutation(s); and (iii) studying the molecular and cellular functions of the genes discovered. So-called "positional cloning" became a mainstay of experimental genetics, identifying pathways that are crucial in development and physiology.

Linkage analysis in humans

For most of the 20th century, genome-wide linkage mapping was impractical in humans: Family sizes are small, crosses are not by design, and there were too few classical genetic markers to systematically trace inheritance. Progress in identifying the genes contributing to human traits was initially limited to studies of biological candidates such as blood-type antigens and hemoglobin β protein in sickle-cell anemia.

In 1980, Botstein and colleagues, building on their use of DNA polymorphisms to study linkage in yeast and the finding of DNA polymorphism at the globin locus in humans, proposed the use of naturally occurring DNA sequence polymorphisms as generic markers to create a human genetic map and systematically trace the transmission of chromosomal regions in families. The feasibility of genetic mapping in humans was soon demonstrated with the localization of Huntington disease in 1983. A rudimentary genetic linkage map with ~400 DNA markers was generated by 1987 and was fleshed out to ~5000 markers by 1996. Physical maps providing access to linked chromosomal regions were developed by 1995. With these tools, positional cloning became possible in humans, and the number of disorders tied to a specific gene grew from ~100 in the late 1980s to >2200 today.

Several lessons emerged from studies of Mendelian disease genes: (i) The "candidate gene" approach was inadequate; most disease genes were completely unsuspected on the basis of previous knowledge. (ii) Disease-causing mutations often cause major changes in encoded proteins. (iii) Loci typically harbor many disease-causing alleles, mostly rare in the population. (iv) Mendelian diseases often revealed great complexity, such as locus heterogeneity, incomplete penetrance, and variable expressivity.

Geneticists were eager to apply genetic mapping to common diseases, which also show familial clustering. Mendelian subtypes of common diseases [such as breast cancer, hypertension, and diabetes] were elucidated, but mutations in these genes explained few cases in the population. In common forms of common disease, risk to relatives is lower than in Mendelian cases, and linkage studies with excellent power to detect a single causal gene yielded equivocal results.

These features were consistent with, but did not prove, a polygenic model. The idea that commonly varying traits might be polygenic in nature was offered in 1910. By 1920, linkage mapping was used to identify multiple unlinked factors influencing truncate wings in Drosophila, and a mathematical framework was developed for relating Mendelian factors and quantitative traits. In the late 1980s, linkage mapping of complex traits was made feasible for experimental organisms through the use of genetic mapping in large crosses. But there was little success in humans.

Genetic association in populations

A possible path forward emerged from population genetics and genomics. Instead of mapping disease genes by tracing transmission in families, one might localize them through association studies—that is, comparisons of frequencies of genetic variants among affected and unaffected individuals. Genetic association studies were not a new idea. In the 1950s, such studies revealed correlations between blood-group antigens and peptic ulcer disease; in the 1960s and 1970s, common variation at the human leukocyte antigen (HLA) locus was associated with autoimmune and infectious diseases; and in the 1980s, apolipoprotein E was implicated in the etiology of Alzheimer's disease. Still, only about a dozen extensively reproduced associations of common variants (outside the HLA locus) were identified in the 20th century.

A central problem was that association studies of candidate genes were a shot in the dark: they were limited to specific variants in biological candidate genes, each with a tiny a priori probability of being disease-causing. Moreover, association studies were susceptible to false positives due to population structure, because there was no way to assess differences in the genetic background of cases and controls. Although many claims of associations were published, the statistical support tended to be weak and few were subsequently replicated.

In the mid-1990s, a systematic genome-wide approach to association studies was proposed: to develop a catalog of common human genetic variants and test the variants for association to disease risk. The focus on common variants as a mapping tool was a matter of practicality, grounded in population genetics. The human population has recently grown exponentially from a small size. Humans have limited genetic variation: The heterozygosity rate for single-nucleotide polymorphisms (SNPs) is ~1 in 1000 bases. Moreover, perhaps 90% of heterozygous sites in each individual are common variants, typically shared among continental populations.

If most genetic variation in an individual is common, then why are mutations responsible for Mendelian diseases typically rare? One answer is natural selection: mutations that cause strongly deleterious phenotypes—as most Mendelian diseases appear to be—are lost to purifying selection. But if deleterious mutations are typically rare, how could common variants play a role in disease? Common diseases often have late onset, with modest or no obvious impact on reproductive fitness. Mildly deleterious alleles can rise to moderate frequency, particularly in populations that have undergone recent expansion. Moreover, some alleles that were advantageous or neutral during human evolution might now confer susceptibility to disease because of changes in living conditions accompanying civilization. Finally, disease-causing alleles could be maintained at high frequency if they were under balancing selection, with disease burden offset by a beneficial phenotype (as in sickle-cell disease and malaria resistance).

These lines of reasoning led to the so-called "common disease–common variant" (CD-CV) hypothesis: the proposal that common polymorphisms (classically defined as having a minor allele frequency of >1%) might contribute to susceptibility to common diseases. If so, genome-wide association studies (GWAS; see also under “GWAS”) of common variants might be used to map loci contributing to common diseases. The concept was not that all causal mutations at these genes should be common (to the contrary, a full spectrum of alleles is expected), only that some common variants exist and could be used to pinpoint loci for detailed study. It took a decade to develop the tools and methods required to test the CD-CV hypothesis: (i) catalogs of millions of common variants in the human population, (ii) techniques to genotype these variants in studies with thousands of patients, and (iii) an analytical framework to distinguish true associations from noise and artifacts.

 Cataloging SNPs and linkage disequilibrium

 Pilot projects in the late 1990s showed that it was possible to identify thousands of SNPs and to perform highly multiplexed genotyping by means of DNA microarrays. A public-private partnership, the SNP Consortium, built an initial map of 1.4 million SNPs; this has grown to more than 10 million SNPs  and is estimated to contain 80% of all SNPs with frequencies of >10%. As the SNP catalog grew, a critical question loomed: would GWASs require directly testing each of the ~10 million common variants for association to disease? That is, if only 5% of variants were tested, would 95% of associations be missed? Or could a subset serve as reliable proxies for their neighbors? Experience from Mendelian diseases suggested that substantial efficiencies might be possible. Each disease-causing mutation arises on a particular copy of the human genome and bears a specific set of common alleles in cis at nearby loci, termed a haplotype.
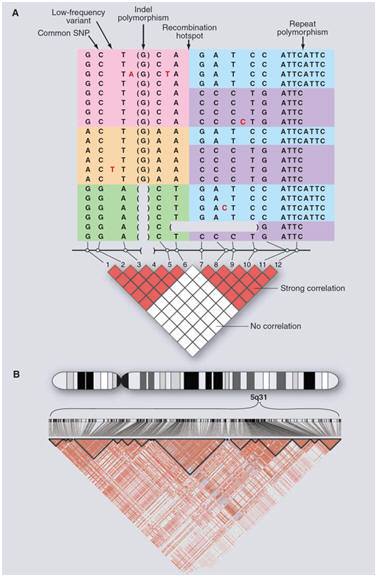
 Because the recombination rate is low [~1 crossover per 100 megabases (Mb) per generation], disease alleles in the population typically show association with nearby marker alleles for many generations, a phenomenon termed linkage disequilibrium (LD) (Figure 1).


Figure 1. DNA sequence variation in the human genome. (A) Common and rare genetic variation in 10 individuals, carrying 20 distinct copies of the human genome. The amount of variation shown here is typical for a 5-kb stretch of genome and is centered on a strong recombination hotspot. The 12 common variations include 10 SNPs, an insertion-deletion polymorphism (indel), and a tetranucleotide repeat polymorphism. The six common polymorphisms on the left side are strongly correlated. Although these six polymorphisms could theoretically occur in 26 possible patterns, only three patterns are observed (indicated by pink, orange, and green). These patterns are called haplotypes. Similarly, the six common polymorphisms on the right side are strongly correlated and reside on only two haplotypes (indicated by blue and purple). The haplotypes occur because there has not been much genetic recombination between the sites. By contrast, there is little correlation between the two groups of polymorphisms, because a hotspot of genetic recombination lies between them. The pairwise correlation between the common sites is shown by the red and white boxes below, with red indicating strong correlation and white indicating weak correlation. In addition to the common polymorphisms, lower-frequency polymorphisms also occur in the human genome. Five rare SNPs are shown, with the variant nucleotide marked in red and the reference nucleotide not shown. In addition, on the second to last chromosome, a larger deletion variant is observed that removes several kilobases of DNA. Such larger deletion or duplication events (i.e., CNVs) may be common and segregate as other DNA variants. (B) Small regions such as in (A) are often embedded in genomic regions with much greater extents of LD. The diagram shows actual data from the International HapMap Project, showing 420 genetic variants in a region of 500 kb on human chromosome 5q31. Positions of the variants and the pairwise correlations are shown below. Blocks of strong correlation are indicated by the black outlines. Longer-range patterns are often more complex than shown in (A) because weaker recombination hotspots may reduce, but not completely eliminate, marker-to-marker correlation.

Mapping the chromosomal location (locus) of genes by linkage analysis

Chromosomal DNA markers

To understand chromosomal mapping of genes, one must first understand chromosomal markers, chromosomal crossovers (recombination), and the concept of genetic linkage. For most inherited diseases, we do not know the responsible gene or protein. For some time, it has been possible to map the location of genes without knowledge of the causative gene or protein. This was initially referred to as reverse genetics and now more appropriately named positional mapping and cloning, since one clones the gene knowing only its chromosomal position relative to another chromosomal marker. A chromosome is a linear molecule of DNA, varying in length from 50 million bp (chromosome 21, smallest) to 263 million bp (chromosome 1, largest). A chromosomal marker is a polymorphic sequence of DNA (referred to as genotyping) with known chromosomal position which can be detected by analyzing (genotyping) an individual’s DNA. DNA markers are now available to span each chromosome at intervals of 3 to 5 million bp. The routine is to screen with a set of 300 to 800 markers selected to span the human genome. DNA markers, like genes, have two alleles per individual, one from each parent, and are transmitted to offspring according to Mendel’s law with the individual being heterozygous or homozygous for that marker. For a marker to be informative it must be heterozygous. When all of the markers are placed together on each chromosome and the genetic distance estimated, a genetic map is produced. Genetic distance is measured in terms of centamorgans (cM), named after the geneticist, T. H. Morgan. One centamorgan approximates 1 million basepairs (mbp). The availability of the human genome DNA sequence now makes it possible to estimate the precise physical distance in basepairs rather than relying on a genetic estimate. Over 5000 highly informative chromosomal markers spanning the entire genome are now available. Identification of a particular locus housing a gene of interest is made possible by showing that the causal gene of interest is in close proximity to one of the DNA markers of known chromosomal location, a method referred to as genetic linkage analysis. Once a disease is linked to a marker of known chromosomal locus, it means the disease locus and the marker are on the same chromosome and in close physical proximity. One then attempts to identify other DNA markers to flank the disease locus to reduce the distance between it and the markers.

Chromosomal crossover (Recombination)

Since humans inherit two sets of autosomal chromosomes (diploid), one from each parent, all of the genes carried by the autosomal chromosomes have two forms, referred to as alleles, one on each chromosome. The two alleles occupy the same chromosomal locus on different chromosomes (homologous), which give rise to the terminology of homologous loci on homologous chromosomes. Which of the parents two chromosomes is inherited by the offspring is random, meaning there is only a 50% chance as to which of the parents’ two chromosomes will be inherited by the offspring. In addition which of the parents’ two alleles is transmitted to the offspring depends on another process referred to as chromosomal crossover, which occurs between pairs of homologous chromosomes. Prior to meiosis, homologous chromosomes and only homologous chromosomes come together and form bridges (chiasmata, usually two per pair), between them such that segments of equal proportions are exchanged between them, giving rise to crossover of the accompanying genes (Fig 2). In genetic parlance chromosomal crossover is referred to as recombination since a segment of one chromosome has broken away and replaces the same segment of the other pair such there is simply an exchange of equal proportions between the two pairs. Thus there is no loss or gain of chromosome or genes. This is the basis for genetic diversity within the species and why no two offspring will have the same genes. However, it is important to point out that this process of recombination means the allele crossing over to its homologous chromosome l occupies the same location (locus) as on its previous chromosome. Thus, the actual position of the gene or marker on each chromosome referred to as the locus remains the same for any particular allele or marker. Whether genes are separated by recombination depends on the distance between them on the chromosome and the number of meiosis that occur. The further apart the genes are, the more likely they are to be separated (recombination) and the chances increase with every meiosis. While genes are independent units and are passed on in random fashion if two or more genes are close together on the same chromosome and no chiasma is formed between them, they will be coinherited in the offspring. In genetic parlance the two genes are genetically linked. In chromosomal mapping to identify the location of an unknown gene responsible for disease in a family we take advantage of this principal. We analyze (genotype) the DNA of all of the family members, normals and affecteds, for DNA markers spanning each chromosome. If we observe a particular marker or set of markers inherited by the affecteds but not by the normals, it means that marker is in such close physical proximity to the gene that causes the disease that every time the gene causing the disease is inherited so is the DNA marker. The marker and the disease gene are linked and we now know which chromosome and the approximate location (locus) of the gene. It turns out that any two markers, two genes, or a marker and a gene will separate (recombine) at a frequency of 1% per 1,000,000 bp of distance between them. Thus, recombination is very much related to the physical distance between the marker and the gene. The recombination frequency is calculated by dividing the number of crossover events or recombinations by the total number of meioses. Once the locus of a gene is mapped, one can further saturate that region with additional chromosomal markers to minimize the distance between the flanking markers. One would prefer to narrow the region to about 1 million bp, although this is not always possible.

FIG 2. Chromosomal crossovers (recombination).

The basis for chromosomal crossover is illustrated in Fig 3. The locus designated with “A” carries the allele responsible for the disease. The corresponding locus “a” on the homologous chromosome has the allele that codes for the same protein but has not undergone a mutation and is thus the normal allele. The loci designated “B” “b” represent alleles of a DNA marker of known chromosomal location that has nothing to do with the disease. In the right-hand panel the disease and marker loci are so close that they tend to be coinherited in the subsequent offspring, whereas in the left-hand panel the DNA marker of known location is so far from the locus carrying the disease of the allele that it is far less likely to be coinherited in the offspring.

FIG 3. Chromosomal crossover and genetic linkage.


Genetic linkage analysis

Genetic linkage analysis is only appropriate if one has a family of two or three generations in which a particular disease is segregating across the generations and exhibits a Mendelian pattern of inheritance. The family is phenotyped, meaning each family member is assessed clinically for the disease and phenotyped as affected, unaffected, or indeterminant (diagnosis cannot be ascertained). A pedigree is then constructed of the families showing affected, unaffected, and indeterminant, as indicated in Fig 4. DNA is analyzed for the whole family of both affected, normal, and indeterminant individuals, which consists of genotyping for all of the DNA markers selected to span the human genome, initially a set of 300 to 800 markers. Following genotyping to exclude or prove linkage to a DNA marker, it is necessary to perform this analysis utilizing computerized techniques. Frequently, the marker and the gene are coinherited only in affected individuals but this may not always be 100%, keeping in mind anything over 50% coinheritance could reflect genetic linkage. Several methods have been used all based on computer analysis with the most common being Maximal Likelihood Estimate. One estimates the probability of a particular inheritance pattern indicating linkage. This probability can then be compared to the probability of that particular inheritance pattern not being linked. The ratio of these two probabilities (that is, of linkage at a given recombination fraction versus nonlinkage) is called the Odds Ratio for Linkage. This ratio is usually expressed as a log rhythm to base 10. The value is called the log rhythm of the odds or LOD score. Thus, a LOD score of one represents 101 odds that a marker is genetically linked to the gene. If the odds are 1000:1 or 103, the log rhythm of these odds would be 3 and is referred to as a LOD score of 3. The minimum LOD score for genetic linkage is 3 in the case of autosomal-dominant disease. In the case of X-linked disease a LOD score of 2 is accepted for linkage. To exclude genetic linkage simply requires a LOD score of −2 or less. In biostatistical terms, a LOD score of 3 represents 95% likelihood of linkage, whereas a LOD score of 4 represents 99% chance of linkage.

FIG 4. A pedigree of three generations having individuals affected with hypertrophic cardiomyopathy (HCM). The open circles indicate unaffected females; the open squares indicate unaffected males; the solid symbols indicate affected individuals (both male and female); the slash through a symbol indicated the patient is dead; and a circle or square within the circle or square indicated the diagnosis is uncertain. DNA was analyzed for restriction fragment length polymorphisms (RFLPs) by Southern blotting, and the results are shown on this autoradiograph for 11 of the individuals in the pedigree. Each vertical lane represents the DNA of the individual indicated by the number above, which corresponds to the same number on the pedigree. The DNA was digested with the restriction endonuclease Taq1 and separated on agarose gel electrophoresis. It was then denatured into its two separate strands, transferred to a nylon membrane by the Southern transfer technique, and probed with a 32P-labeled probe. The probe, referred to as P436, was derived from part of the beta-myosin gene, which is known to be located on the long arm of the chromosome 14. This probe recognizes two alleles, one at 4.2 kb and the other at 1.8 kb. The larger fragment at the top is consistently present in all of the individuals, so we will be examining the polymorphic alleles of 4.2 kb (A1) and 1.8 kb (A2). Individual 51 is an affected female who is heterozygous, having received the A1 allele from one of her parents and the A2 allele from the other parent. Individual 49, in contrast, is homozygous, having inherited the identical A2 allele from both the mother and the father. Individual 53, a normal female, is also homozygous for the A2 allele. Individual 57, a normal female, is heterozygous at this locus, having both the A1 and the A2 alleles. Individual 59, an affected male with HCM, is also heterozygous. Individual 64, an affected male, is homozygous, with both alleles being A2. Individual 66, an affected female, is heterozygous, having both the A1 and the A2 alleles. Individuals 67 (normal male), 72 (normal female), and 78 (affected female) are all homozygous for the A2 allele. Individual 79 is a normal male and is heterozygous, having both A1 and A2 alleles. Computer analysis of the beta-myosin gene in this family together with that in other families showed linkage between this marker and the disease for hypertrophic cardiomyopathy. A LOD score was obtained of greater than 4, indicating the odds for linkage are more than 99%. The analysis of this Southern blot illustrates several of the key features of linkage analysis explained in the text: (1) the same polymorphic pattern at the marker locus can be seen in both a normal and an affected individual within the same family; and (2) some affected individuals are homozygous at the marker locus while others are heterozygous, and, as indicated in the text, only those individuals who are heterozygous for the two alleles will provide information for linkage analysis with this particular marker locus. Thus, which allele is inherited by the sibling from the parents at the marker locus is completely random and independent of which allele is inherited at the disease gene locus, despite the two loci being linked. The analysis in this family also shows how, because of the lack of information, one may require a larger number of individuals than initially expected to ascertain whether linkage is present between the marker locus and that of the disease. In several of the individuals shown here the marker locus is homozygous and therefore will contribute almost no information to the linkage analysis. For a probe to be informative, it must be heterozygous, which is frequently not the case, as illustrated in this pedigree analysis.


To map a chromosomal locus by linkage analysis usually requires a pedigree of at least two generations and preferably three generations having at least 10 affected individuals. A major problem is always the certainty whereby the phenotype can be determined, which is very much the responsibility of the physician. It is hoped that future efforts to more precisely phenotype will be developed to facilitate our search for disease-related genes.

Summary of axioms of genetic linkage analysis

1 In reference to genes on autosomal chromosomes, every individual has two forms of the gene, referred to as alleles, one being inherited from the mother and the other inherited from the father. In individuals with dominant disease, one allele is defective and the other is normal.

2 The DNA marker of known chromosomal location to which a disease gene is linked also has two alleles, one from the father and one from the mother.

3 When a DNA marker and disease-related gene are said to be genetically linked, it means that the two loci are linked, not their alleles.

4 Since the two loci are linked, and not the alleles, which allele a particular offspring gets is total chance since the inheritance of either or both alleles at a particular locus is independent of the other.

5 Neither of the alleles at the maker locus has anything to do with causing the disease. Both alleles of the marker locus occur in the general population and do not themselves cause disease. They simply reside at a locus that is in close enough physical proximity to the locus that contains the disease-producing gene to be coinherited more often than by chance.

6 To be informative for linkage analysis, the alleles of the marker locus must be heterozygous. This means that the two alleles at the marker locus must not have a nucleotide sequence identical to that of the probe being utilized for their detection but must be polymorphic.

7 Linkage of a marker locus and a disease-related locus implies that the two are coinherited more often than by chance alone, which means more often than 50% of the time. It does not mean, however, that the two loci are always coinherited; in fact, only if they are extremely close would this be true.

8 It follows from previous axioms that, in analyzing the DNA of the marker loci of individuals within families affected with the disease, the same pattern may be seen in an individual without the disease as in those individuals with the disease. This is why computer analysis is necessary to ascertain whether the disease allele is more commonly inherited with one or more of the alleles at the marker loci than would be expected by chance.

9 Crossover or recombination occurs between, and only between, homologous chromosomes, so the alleles that cross over or recombine occupy the same locus on their new chromosomes as they did on the previous ones.


Isolation and identification of a gene

Once the locus of the gene has been determined, one attempts to narrow the region between the flanking markers before proceeding to identify the gene. Today with the sequence of the genome known and many genes having already been mapped to their chromosomal locus, the first approach is to sequence genes in the mapped region as potential candidate genes. If the candidate genes in the region after being sequenced do not contain the responsible mutation, it may be necessary to clone the region and identify novel genes to be sequenced as candidates for the mutation. Once the mutation is identified, one then determines if it is indeed the causative mutation. The minimum requirement is the mutation be found in affected and not in normal family members and be absent in at least 300 normal individuals representative of the population from which the family with the disease was selected (e.g. Caucasian, African, or Chinese).

Overview of phenotyping, genotyping, mapping, and identification of the gene

The overall approach to chromosomal mapping of heredity diseases by linkage analysis and subsequent isolation of the gene may thus be summarized categorically as follows: (1) collection of data from families having individuals affected by this specific disease through two or three generations; (2) the disease segregates in a Mendelian pattern; (3) clinical assessment to provide an accurate diagnosis of the disease using consistent and objective criteria to separate normal individuals from those affected and those who are indeterminate or unknown; (4) collection of blood samples for extraction of DNA for immediate analysis and subsequent whole-genome amplification should be stored in small aliquots to avoid repeated freezing and thawing; (5) development of a pedigree for analysis of the families; (6) DNA genotyping with a large number of DNA markers of known chromosomal loci that span the human genome; (7) linkage analysis is performed on the genotypes to map the chromosomal locus; (8) development of flanking markers around the region containing the disease locus; (9) isolation and cloning of the region of DNA containing the gene; (10) sequence analysis of the gene to identify the precise mutation causing the disease; (11) demonstration of the causal relationship between the defective gene and the disease by showing segregation of the mutation in affected individuals only and absence in an independent, unrelated normal population.

Modifier genes and phenotypic variability

A common feature of many single-gene disorders, is the presence of significant variability in the phenotypic expression of affected patients. This variability is seen between families and even within affected members of the same family and causative mutation. A significant factor for this genetic background is the presence of genomic DNA polymorphisms or SNPs in genes other than the disease-causing gene. SNPs are located in coding or regulatory regions of genes and can affect the gene expression and function. SNPs imposing functional differences for proteins involved in pathways of cardiac hypertrophy phenotype will alter the end phenotype in single-gene disorders, and thus, are referred to as “modifier genes.” Modifier genes are neither necessary nor sufficient to cause a disease but may influence the severity or risk of the disease. The identity of most modifier genes remains largely unknown. The identification of these modifiers will provide additional substrates for potential therapeutic intervention.

Although phenotypic variability may exist in patients caused by the same gene, due to genetic modifiers, correlation between the causal gene and the degree of disease severity and risk exists. However, due to the low frequency of most mutations consistent correlation to outcome can be made for only a few mutations. Importantly, it is necessary to recognize the limitations of these generalizations. Many confounding variables, such as small number of families with identical mutations, the influence of modifier genes, and coexisting morbidities make strict genotype–phenotype.


Next page: Genomic and cDNA libraries Go back to: Genetic transmission