Microarray analysis
DNA microarray technology (also known as DNA arrays, DNA chips, gene chip or biochips) started to appear during the second half of the 1990s and has historically evolved from the initial experimental reports published in the mid 1970s which indicated that labelled nucleic acids could be used to monitor the expression of nucleic acid molecules attached to a solid support. In a broad sense, the technology may be defined as a high-throughput, largescale and versatile technology used for parallel gene expression analysis for thousands of genes of known and unknown function (e.g. comparative mRNA expression profiling and genome-wide analysis of mRNA expression), or DNA homology analysis for detecting polymorphisms and mutations in both prokaryotic and eukaryotic genomic DNA. Either 25-nucleotide long fragments of known DNA sequences (oligonucleotide arrays for sequence variation studies) or cDNA fragments (cDNA arrays for expression profile studies) are immobilised on glass surfaces on a 1.3cm x 1.3cm microarray in a predetermined order (grid). Thousands of fragments can be stored on a single chip. The sample of interest (tumour, tissue, species) to be examined for gene expression profile should be available in a form that will allow RNA extraction. The RNA is labelled with fluorescent and hybridised with the fragments on the microarray. Hybridisation events are captured by scanning the surface of the microarray with a laser scanning device and measuring the fluorescence intensity at each position in the microarray. The fluorescence intensity of each spot on the array is proportional to the level of expression of the gene represented by that spot. DNA microarrays have been used to understand the cell cycle, haematopoietic differentiation, interferon gamma treatment and cancer classification. The ability to monitor the expression levels of thousands of genes simultaneously offers the opportunity to expand the analysis of cancer genetics beyond single–candidate gene approaches. Microarrays are capable of monitoring the expression levels of the entire human genome using nanograms of total RNA. The major advantage of gene arrays is thus that they can provide information on thousands of targets in a single experiment. The challenge is, however, the interpretation of the microarray data. The key is to develop methods for recognizing meaningful gene expression patterns and distinguishing those patterns from noise.
DNA Microarray experiments
The principle of DNA microarray
technology is based on the fact that complementary sequences of DNA can be
used to hybridise immobilised DNA molecules. This involves three major
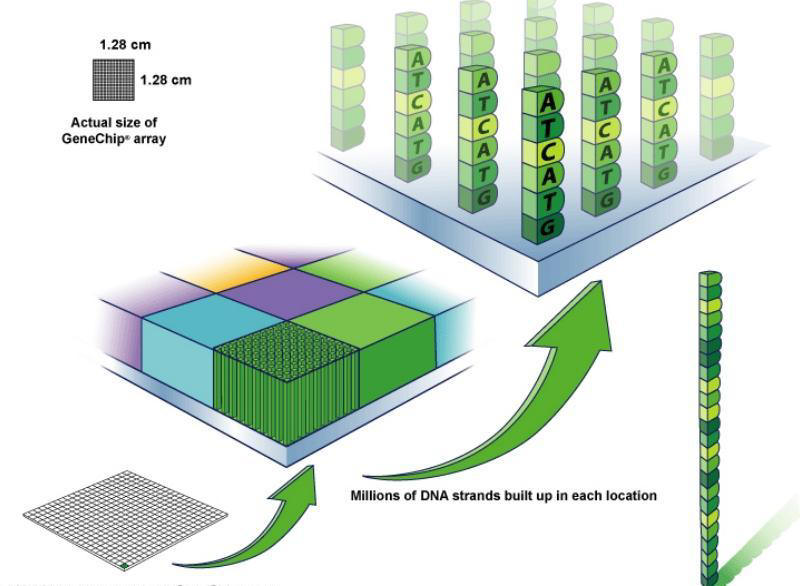
multi-stage steps; 1. Manufacturing of microarrays: This step involves the
availability of a chip or a glass slide with its special surface chemistry,
the robotics used for producing microarrays by spotting the DNA (targets)
onto the chip or for their in situ synthesis. Some array manufacturers offer custom analysis services
and may perform the probe labeling and hybridization reactions as a service.
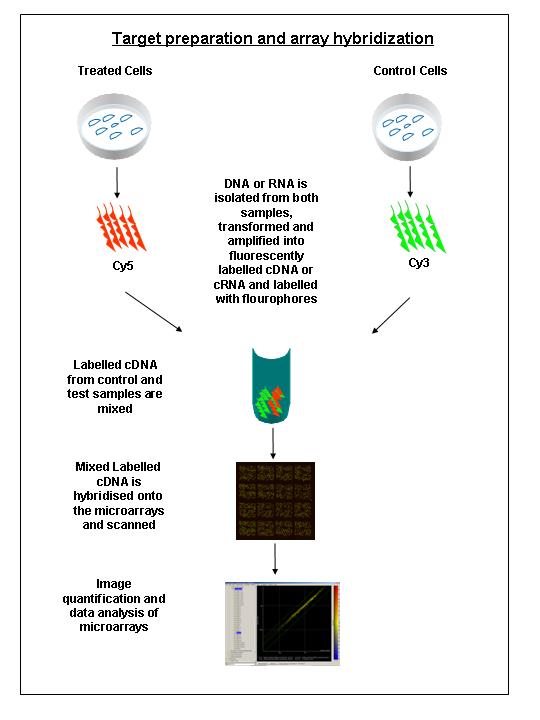
2. Sample preparation and array hybridisation step: This step involves mRNA
or DNA isolation followed by fluorescent labelling of cDNA probes,
hybridisation of the sample to the immobilised target DNA and removing the unhybridized cDNA
.
3. Image acquisition and data analysis: Finally, this step involves
microarray scanning, and image analysis using sophisticated software
programs that allows us to quantify and interpret the data.
However, there are four major steps in performing a typical microarray experiment in the laboratory:
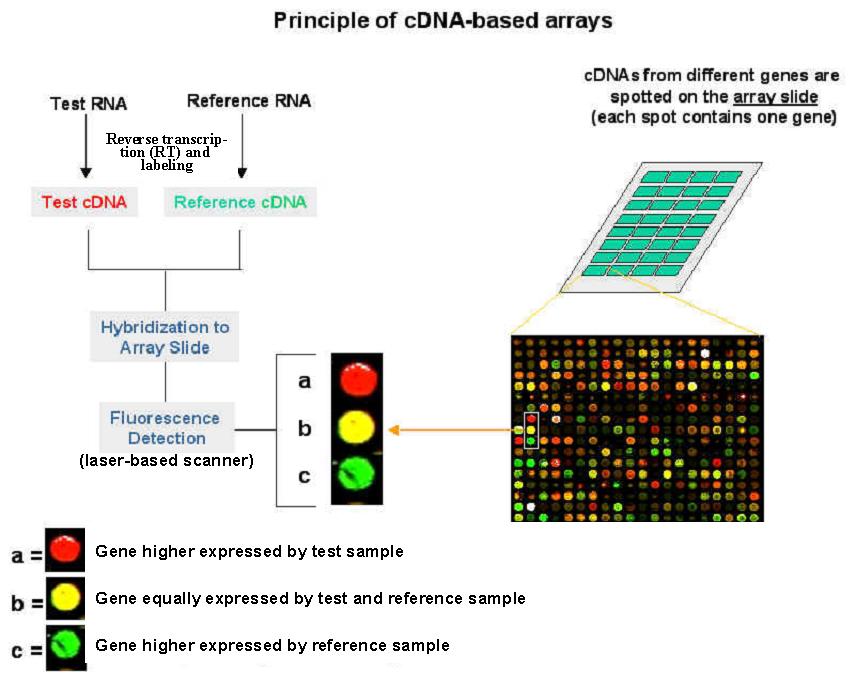
1. Sample preparation and labelling.
Isolatie total RNA containing messenger RNA (mRNA) that ideally represents a
quantitative copy of genes expressed at the time of sample collection (experimental
sample & reference sample). This step is crucial, simply because the overall
success of any microarray experiment depends on the quality of the RNA.The
sample mRNA extracted from the biological sample of interest and the
reference are then separately converted into complementary DNA (cDNA) using
a reverse-transcriptase enzyme. This step also requires a short primer to
initiate cDNA synthesis. Next, each cDNA (Sample and Control) are labelled
with a different tracking molecule, often fluorescent cyanine dyes (i.e. Cy3
and Cy5)
2. Hybridisation (the process of joining two complementary strands of DNA to
form a double-stranded molecule). The labelled cDNAs (Sample and Control)
are mixed together and then competitively hybridised against denatured PCR
product or cDNA molecules spotted on a glass slide. Ideally, each molecule
in the labelled cDNA will only bind to its appropriate complementary target
sequence on the immobilised array.
3. Washing. First to remove any labelled cDNA that did not hybridise on the
array, and secondly to increase stringency of the experiment to reduce cross
hybridisation. The later is achieved by either increasing the temperature or
lowering the ionic strength of the buffers.
4. Image acquisition and Data analysis: produce an image of the surface of
the hybridised array. The slide is dried and placed into a laser scanner to
determine how much labelled cDNA (probe) is bound to each target spot. Laser
excitation of the incorporated targets yield an emission with characteristic
spectra, which is measured using a confocal laser microscope.
Validation
Differences in expression of specific sequences are often validated by another method of analysis, such as RT-PCR or Northern blot analysis. These same methods can be used for relative or absolute quantitation of specific messages of interest identified by array analysis.
Click here for video 1 on microarrays and here for video 2 on microarrays.
Click
DNA microarray for an animation.Click
DNA microarray for a movie.
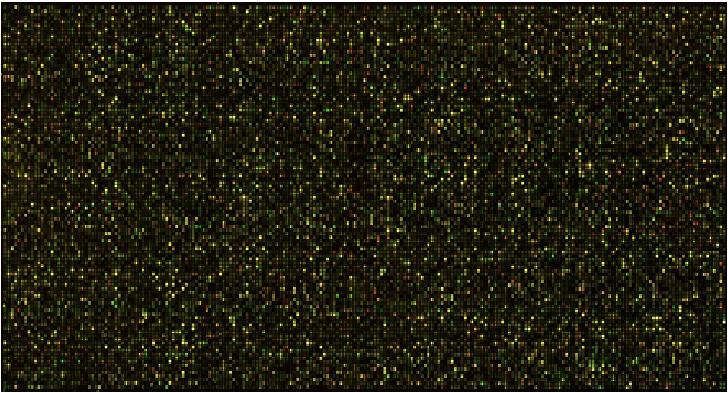
Microarray - technique
Microarray - construction
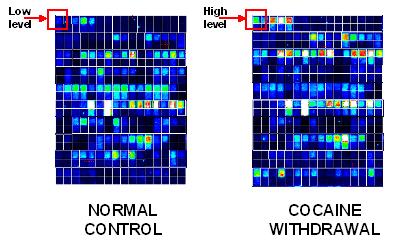
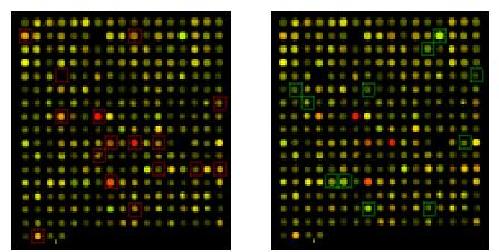 Subarray with up- and downregulated genes indicated
- duplicate
experiment
Subarray with up- and downregulated genes indicated
- duplicate
experiment
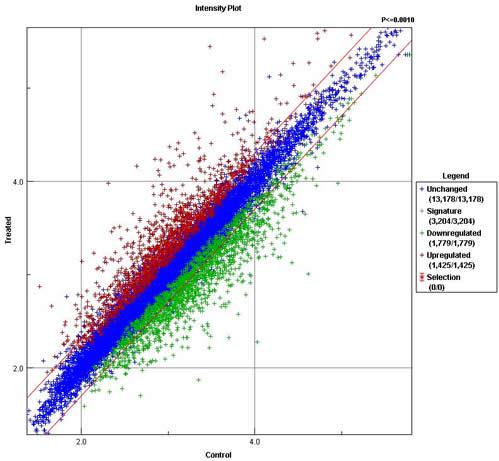 Deviation
indicates upregulation (red) or downregulation (green)
Deviation
indicates upregulation (red) or downregulation (green)