The classical and best-known way to detect DNA, RNA and protein is the use of Southern, northern and western blots, respectively. These blots are named for the target molecule.
Southern blot
DNA cut with restriction enzymes - probed with radioactive DNA.
Northern blot
RNA - probed with radioactive DNA or RNA.
Western blot
Protein - probed with radioactive or enzymatically-tagged antibodies.
In the case of Southern, northern, and western blots, the initial separation of molecules is done on the basis of molecular weight. Following gel electrophoresis, probes are often used to detect specific molecules from the mixture. However, probes cannot be applied directly to the gel. The problem can be solved by three types of blotting methods: Southern blotting, northern blotting and western blotting.
In general, the blot process has the following steps:
- Gel electrophoresis (click for an animation)
- Transfer to solid support (blot);
- Blocking;
- Preparing the probe;
- Hybridization;
- Washing;
- Detection of probe-target hybrids
Southern blot analysis
Southern blotting is a technique for detecting specific DNA fragments in a complex mixture. The technique was invented in the mid-1970s by Edward Southern.
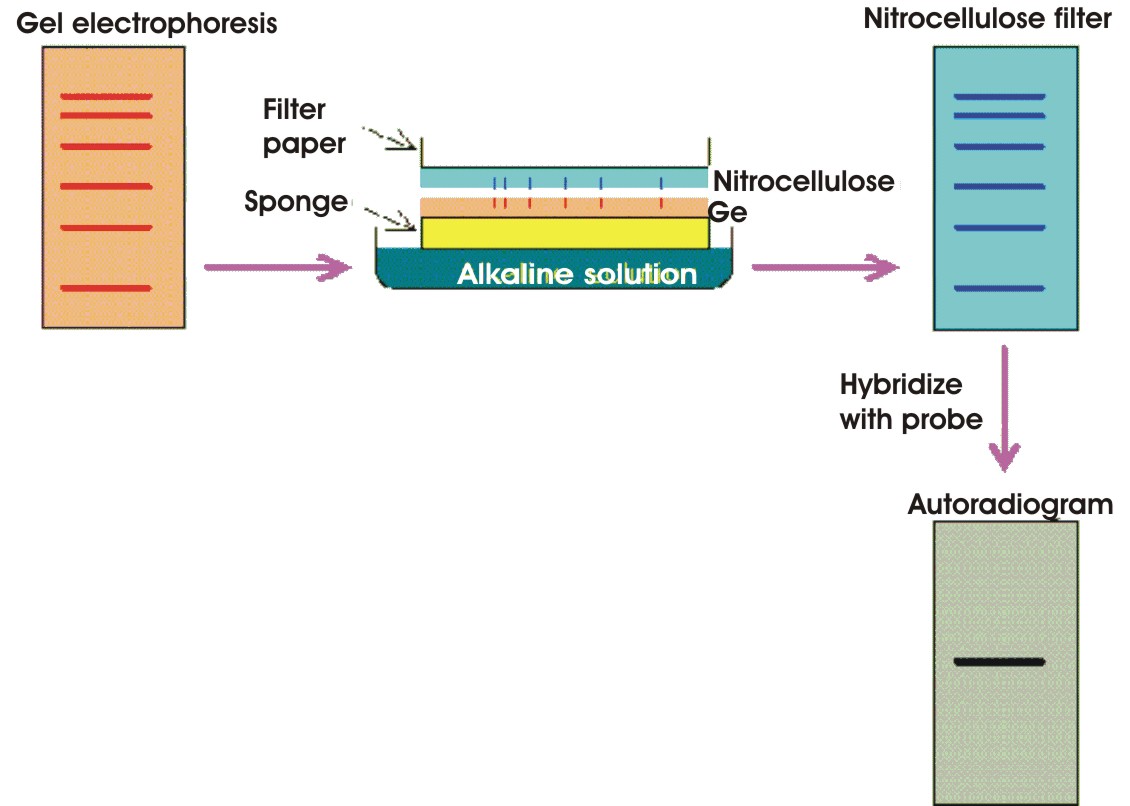
Southern blotting procedure
(a) The DNA to be analyzed is digested with restriction enzymes and then separated by agarose gel electro-phoresis.
(b) The DNA fragments in the gel are denatured with alkaline solution and transferred onto a nitrocellulose filter or nylon membrane by blotting, preserving the distribution of the DNA fragments in the gel.
(c) The nitrocellulose filter is incubated with a specific probe. The location of the DNA fragment that hybridizes with the probe can be displayed by autoradio-graphy.
Northern blot analysis remains a standard method for detection and quantitation of mRNA levels despite the advent of powerful techniques, such as reverse transcription-polymerase chain reaction (RT-PCR), gene array analysis and nuclease protection assays. Northern analysis provides a direct relative comparison of message abundance between samples on a single membrane. It is the preferred method for determining transcript size and for detecting alternatively spliced transcripts. The Northern blotting procedure is straightforward (see below) and provides opportunities to evaluate progress at various points (e.g., integrity of the RNA sample and how efficiently it has transferred to the membrane). RNA samples are first separated by size via electrophoresis in an agarose gel under denaturing conditions. The RNA is then transferred to a membrane, crosslinked and hybridized with a labeled probe. Northern hybridization is exceptionally versatile in that radiolabeled or nonisotopically labeled DNA, in vitro transcribed RNA and oligonucleotides can all be used as hybridization probes. Additionally, sequences with only partial homology (e.g., cDNA from a different species or genomic DNA fragments that might contain an intron) may be used as probes. Northern blotting is thus used for detecting RNA fragments, instead of DNA fragments. The technique is called "Northern" simply because it is similar to "Southern", not because it was invented by a person named "Northern".
This is a brief overview of how a Northern blot (more formally called an RNA blot) is performed and the type of data you can obtain from it.
Northern blots allow investigators to determine the molecular weight of an mRNA and to measure relative amounts of the mRNA present in different samples. 1) RNA (either total RNA or just mRNA) is separated by gel electrophoresis, usually an agarose gel. Because there are so many different RNA molecules on the gel, it usually appears as a smear rather than discrete bands. 2) The RNA is transfered to a sheet of special blotting paper called nitrocellulose, though other types of paper, or membranes, can be used. The RNA molecules retain the same pattern of separation they had on the gel. 3) The blot is incubated with a probe which is single-stranded DNA (or RNA). This probe will form base pairs with its complementary RNA sequence and bind to form a double-stranded RNA-DNA (or RNA-RNA) molecule. The probe cannot be seen but it is either radioactive or has an enzyme bound to it. 4) The location of the probe is revealed because it gives off light which will expose X-ray film or by incubating the blot with a colorless substrate that the attached enzyme converts to a colored product that can be seen. If the probe was labeled with radioactivity, it can expose X-ray film directly
Other techniques to detect RNA include RNase protection assay, in situ hybridization, Polymerase Chain Reaction (PCR) and microarray. Although mostly used for the detection of RNA, in situ hybridization, microarray and PCR are also employed to detect DNA; see under "Detection of RNA", "In situ hybridization", "PCR" and "Microarray analysis" for an overview of these techniques.
Western blotting is used to detect a particular protein in a mixture. The probe used is therefore not DNA or RNA, but antibodies. The technique is also called "immunoblotting". The Western blot, commonly called the protein blot, is a method used to separate proteins by molecular weight (MW in Da or kDa). Similar to the Southern blot for DNA and the Northern blot for RNA, the Western blot utilizes separation of the studied molecule: the proteins are subjected to electrophoresis on polyacrylamide gels that often contain a detergent to separate the molecules by their molecular weight. The separated protein is then transferred to a filter using high-voltage electrophoresis in a similar way to other blotting techniques. Enzyme-linked or isotopically labelled antibodies that are species-specific are applied to the filter. The antibodies bind to the proteins they are specific for and the protein antibody bands can then be visualised by either autoradiographic or calorimetric methods.
Proteomics
Another technique to detect protein is proteomics, the analysis of a proteome (i.e. the analysis of the entire set of proteins in a cell). Systems-level approaches, including proteomics, are required for a more comprehensive understanding of healthy and diseased cells. The proteome is extremely multifaceted owing to splicing and protein modifications, and this is further amplified by the interconnectivity of proteins into complexes and signalling networks that are highly divergent in time and space. Quantification of the proteome expressed in a complex biological system (for example, mammalian cells) is now possible with a high sensitivity and in a reasonable amount of time. Proteome analysis heavily relies on mass spectrometry (MS; see figure below). MS-based proteomics has matured immensely in the last decade through a combination of developments in instrumentation, sample preparation and computational analysis, allowing quantitative system-wide analysis of the proteome, including post-translational modifications (PTMs), protein–protein interactions and cellular localization. With the availability of genomic information, the massive capacity for peptide identification by MS is being used to annotate gene sequences and to find new protein-coding genes and splicing variants. In combination with new approaches to isolate specific PTMs, MS-based studies are revealing a much higher order of proteome complexity in which most proteins are modified by several PTMs that crosstalk in intricate mechanisms to regulate protein function. Protein affinity strategies allow purification of candidate proteins and their interacting partners, which are subsequently identified by MS. These studies describe, with a high degree of detail, dynamic and context-specific protein–protein interaction networks and protein complexes. The improvements in sensitivity, robustness and high-throughput of MS-based proteomics now permits applications in the clinical field, including the possibility of discovering disease-related biomarkers and screening molecular targets of candidate drugs.
Scenarios for proteome expression profiling:
- The combination of high-throughput DNA or RNA sequencing (DNA-seq or RNA-seq) data with massively parallel peptide sequencing data can reveal, for instance, alternative splicing events and can be used to annotate or reannotate genomes
- Proteomes can be quantitatively compared between two or more samples, enabling differential protein expression analyses to be carried out
- When done under controlled conditions, proteomics data can be used to estimate the absolute abundance of proteins (that is, the number of protein copies per cell)
- Advances in multiplexing allow monitoring proteome dynamics of complex biological processes in time
- Fractionation of cellular organelles followed by mass spectrometry analysis represents a unique approach to describe localization of proteins
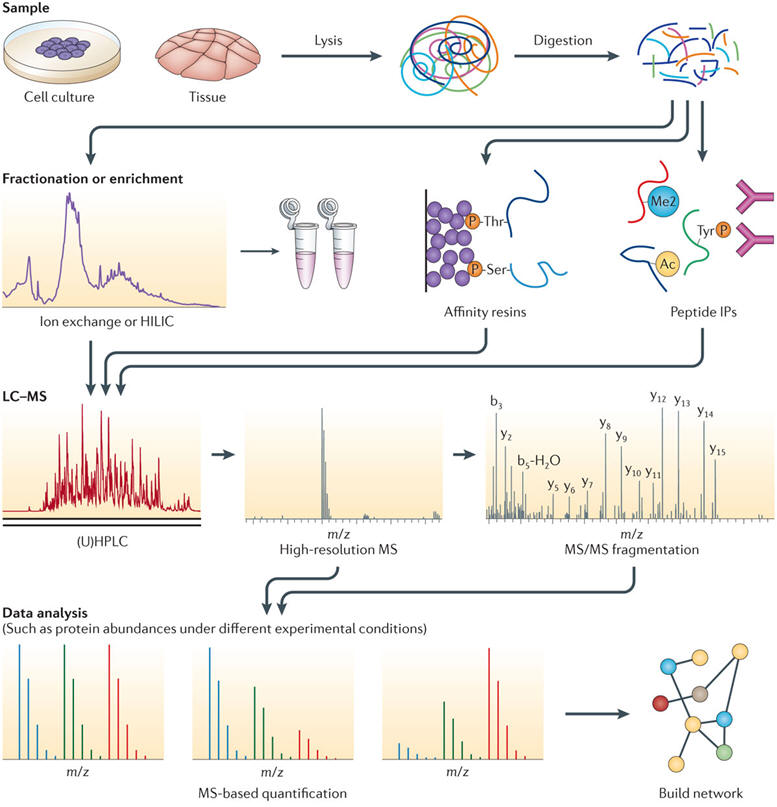
Generalized mass-spectrometry-based proteomics workflow. In the vast majority of proteomics experiments, the extracted proteins are first digested into peptides, usually by trypsin, to create molecular species that are much more manageable in both sample handling and mass spectrometry (MS) analysis. Enzymatic digestion of a full proteome generates hundreds of thousands of peptides: this sample complexity is not directly compatible with the MS analysis. Therefore, the first step in the proteomics workflow is most often directed at reducing the sample complexity either by sample prefractionation or enrichment. In sample prefractionation, the peptide population is fractionated according to its physicochemical properties, such as charge, isoelectric point, hydrophobicity or combinations of these. It is essential here that the chosen fractionation technique is orthogonal to the liquid chromatography (LC) separation just before MS analysis. Alternatively, specific subsets of the sample can be targeted through enrichment of peptides containing modifications (for example, phosphorylation (P), dimethylation (Me2) or acetylation (Ac)) using affinity-based resins or antibody-based immunoprecipitation (IP). These prefractionated or enriched samples are then introduced to the LC system for an additional separation step to reduce complexity further; this can be achieved by using, for example, ultra-high-performance liquid chromatography (UHPLC). Ideally, all peptides eluted from the LC are queried by the mass spectrometer, but in everyday practice, many peptides elute simultaneously and compete for efficient ionization: highly abundant species can suppress the ionization of co-eluting less abundant species, thus preventing their MS analysis. After ionization, peptide precursor ions are introduced into the mass spectrometer, which records their mass-to-charge (m/z) ratio with high accuracy. For identification, single precursors are selected (on the basis of observed intensity) and subjected to a tandem MS (MS/MS) event to generate characteristic fragment ions for the selected precursor. Peaks labelled 'b' are amino-terminal fragment ions, and peaks labelled 'y' are carboxy-terminal fragment ions. The combination of precursor m/z and its fragment ions is then matched to known peptide sequences from large protein databases using search algorithms. Finally, data are quantified (either relatively or absolutely); for example the three data analysis panels in the figure might represent three experimental conditions in which the different proteins (represented by different coloured lines) may or may not change in abundance. These protein abundances are then interpreted and visualized in the context of the biological system under study. HILIC, hypdrophilic interaction liquid chromatography.
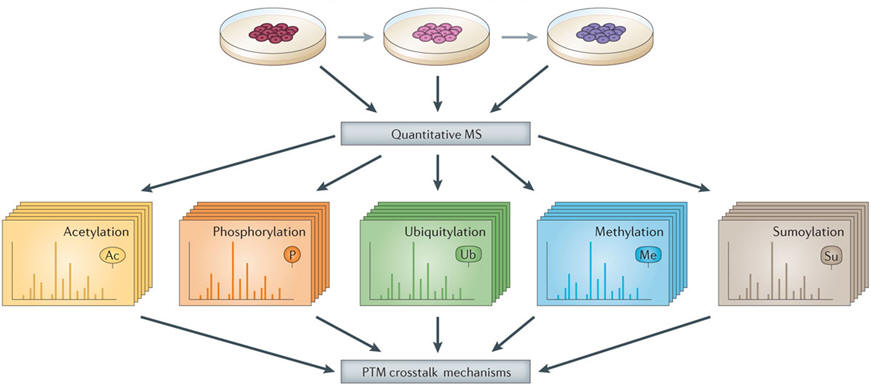
Large-scale mass spectrometry data sets of post-translational modifications (PTMs) allow analysis of PTM crosstalk. Mass spectrometry (MS)‑based proteomics represents a unique tool to identify and quantitatively to monitor global and site-specific changes of PTMs (for example, acetylation, phosphorylation and ubiquitylation). Often, many of these regulatory events coexist in the same proteins. Integration of these analyses will serve as a valuable resource to reveal mechanisms of PTM crosstalk (for example, sequential, exclusive and antagonistic).
| Next page: Detection of RNA | Go back to: Genomic and cDNA libraries |